
Inside the relentless race for AI capacity
Tracking physical AI infrastructure with satellites

Trust but verify. And follow the capex.
We track where capital is actually being deployed in physical infrastructure — from AI data centers to semiconductor fabs. Using satellite sensors, we monitor developments in near real-time. We combine an AI Terrain Classifier, night-time lights, and radar imagery to generate a comprehensive, no BS, ground-level picture of activity.
Today, we replicate the FT’s investigation into Meta’s AI data center in Temple, Texas.
Contents
1. Confirming the FT’s Storyline
The Financial Times article examined several data centers, with Meta’s Texas facility receiving the most detailed coverage. As such, we focus on replicating the satellite signature for this specific site. In this section, we compare the FT’s optical imagery and storyline with our radar data — providing the most direct, apples-to-apples comparison.
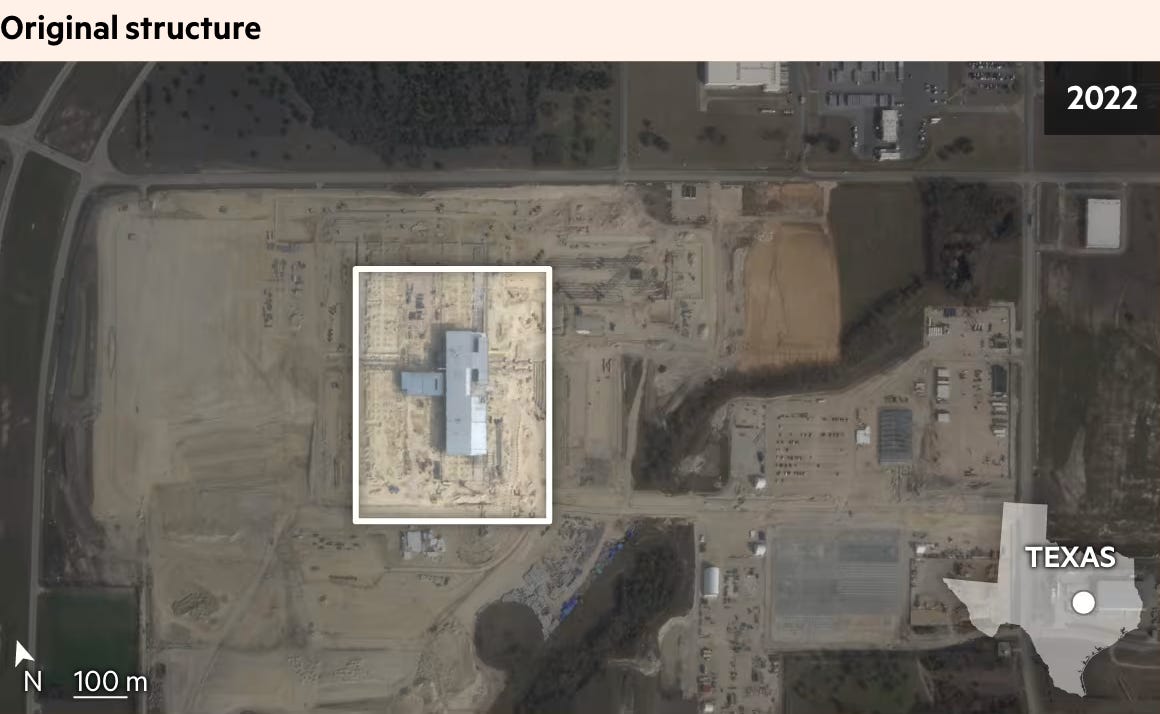
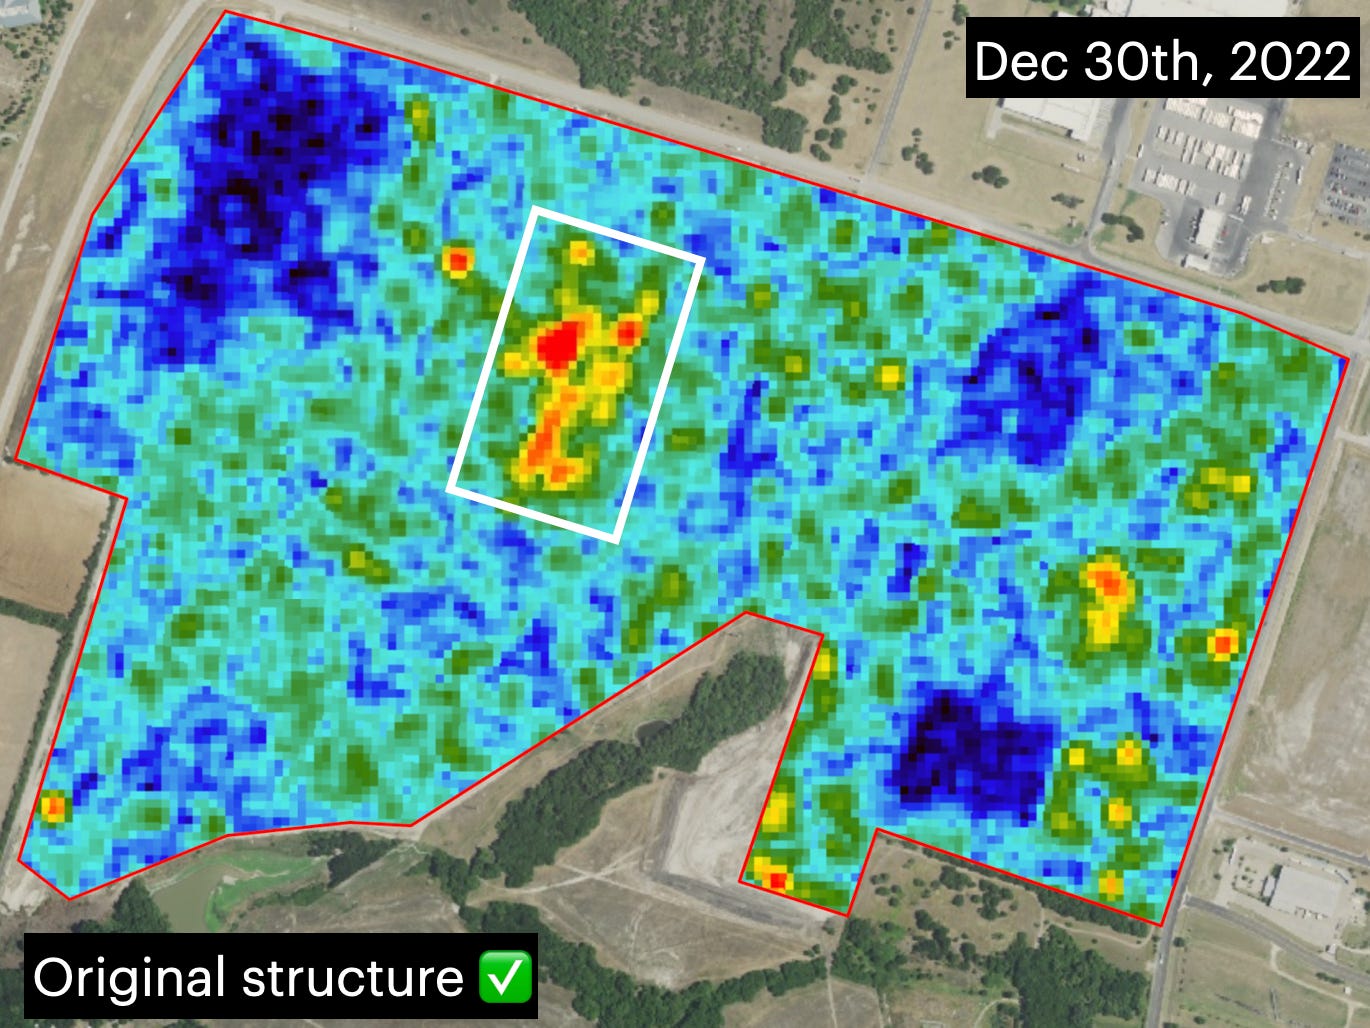
A. Original structure
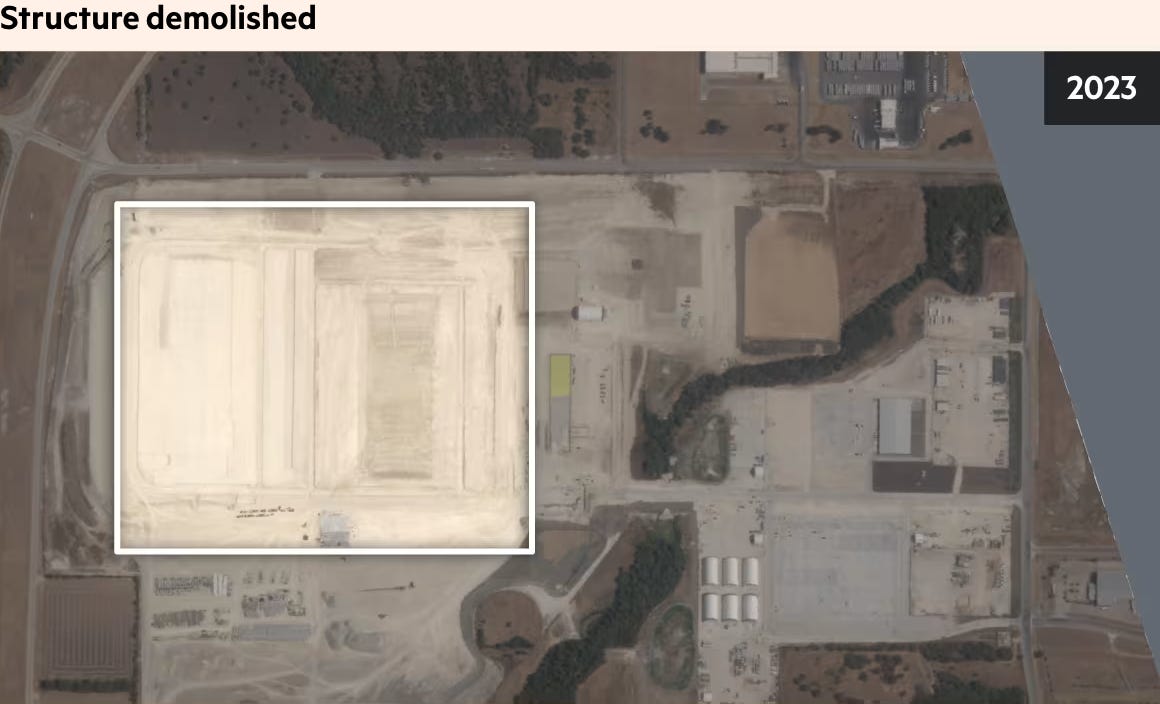
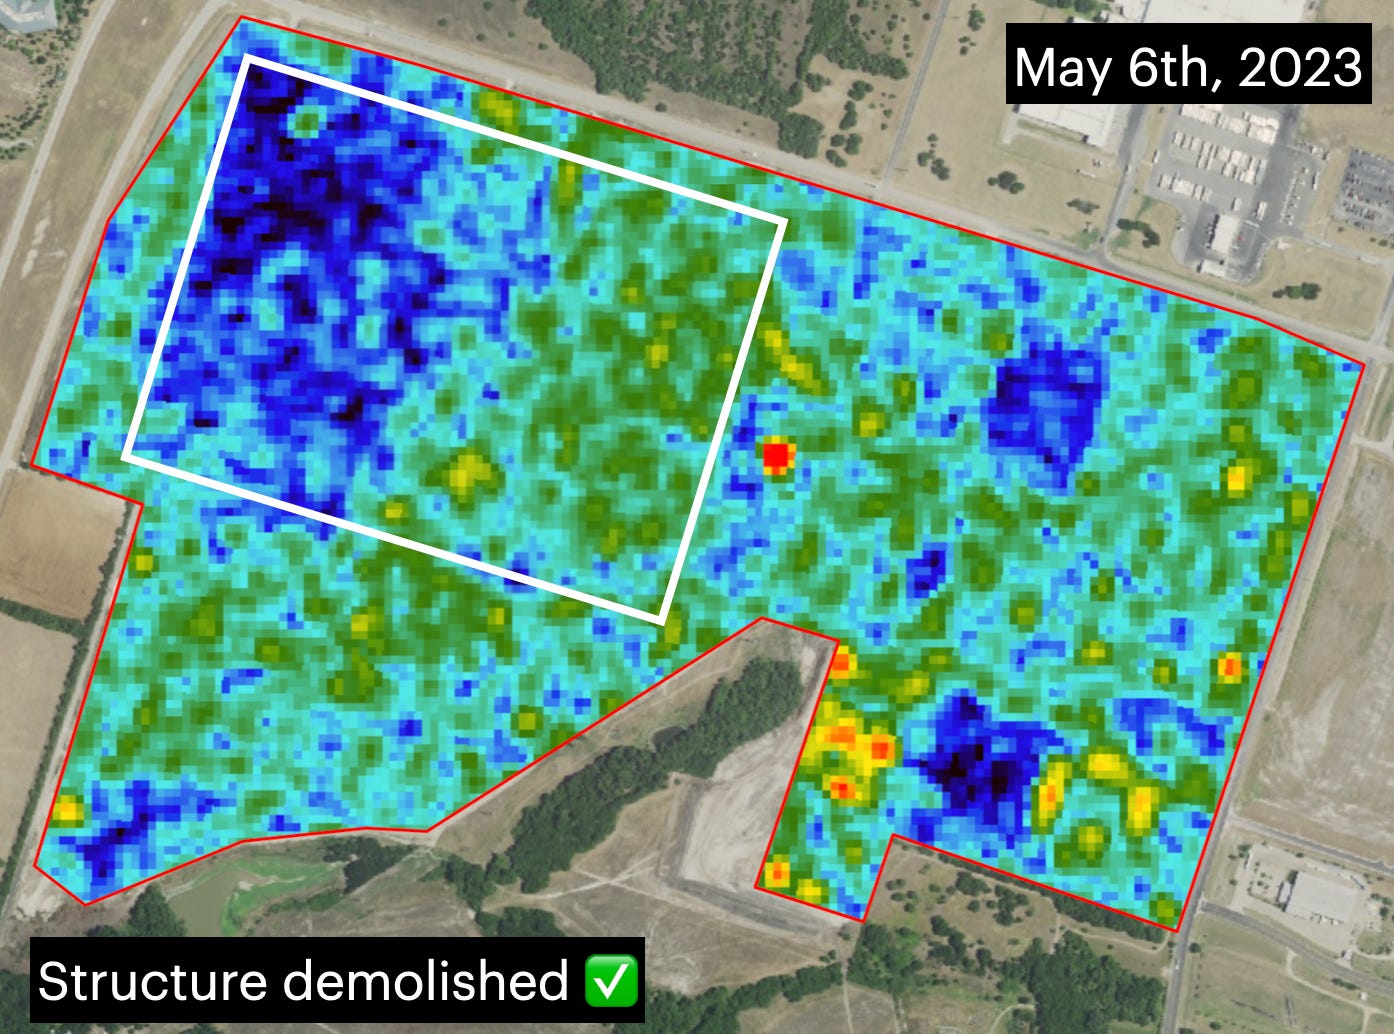
B. Structure demolished
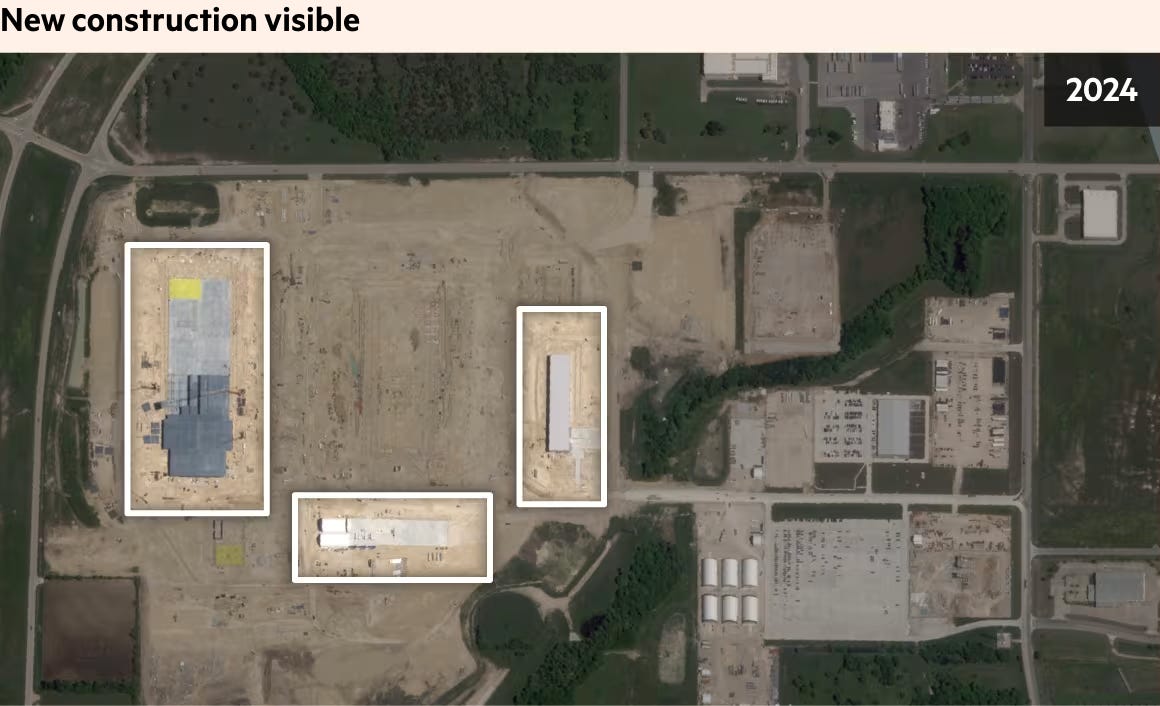
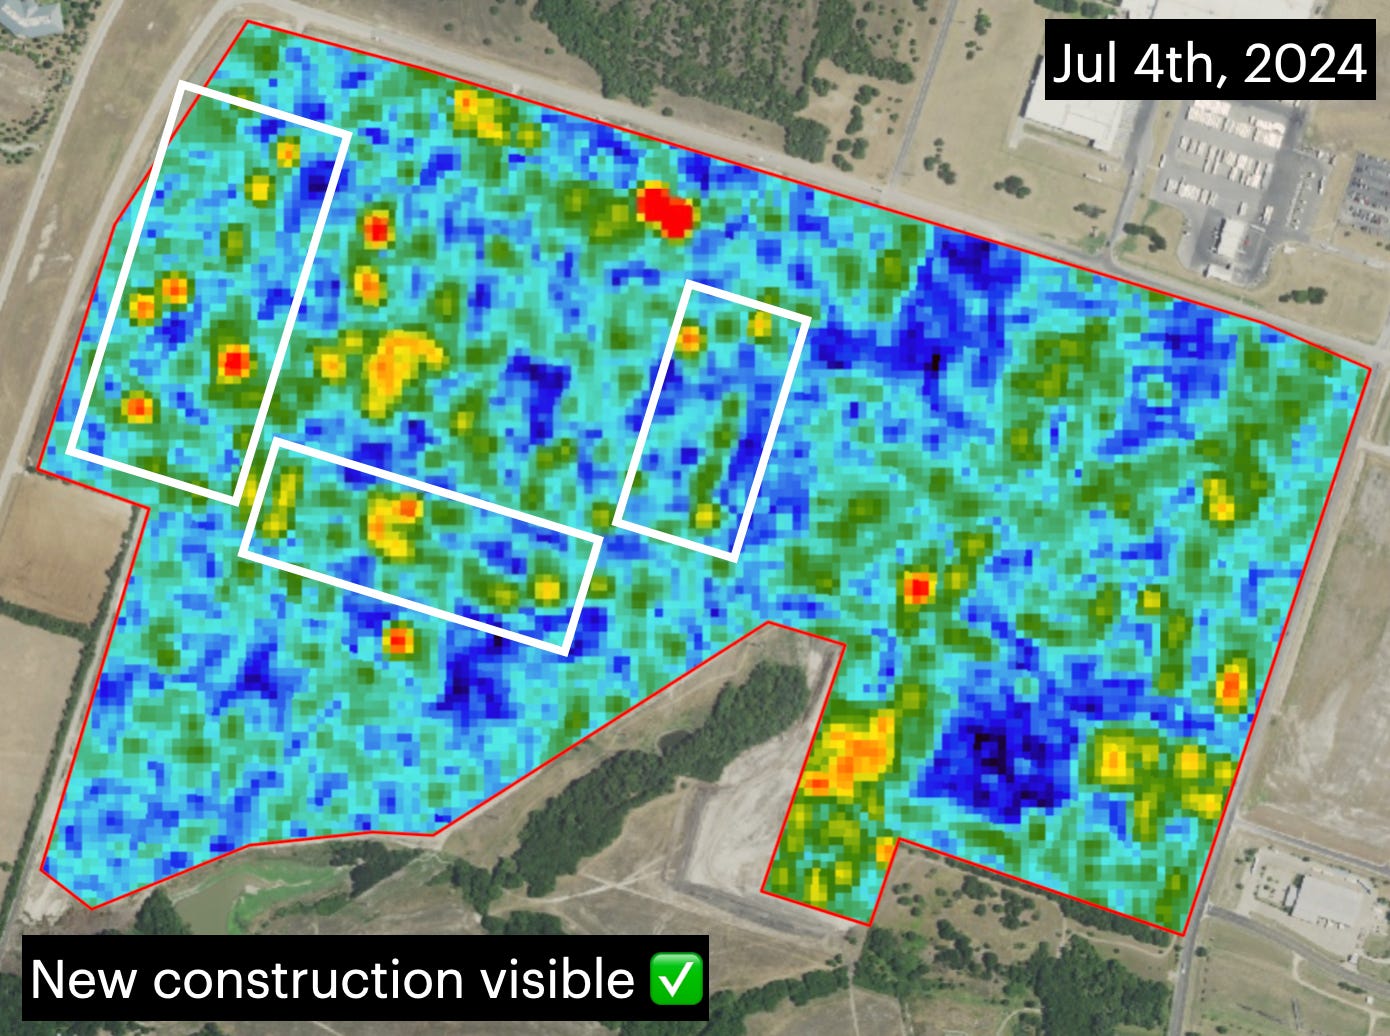
C. New construction visible
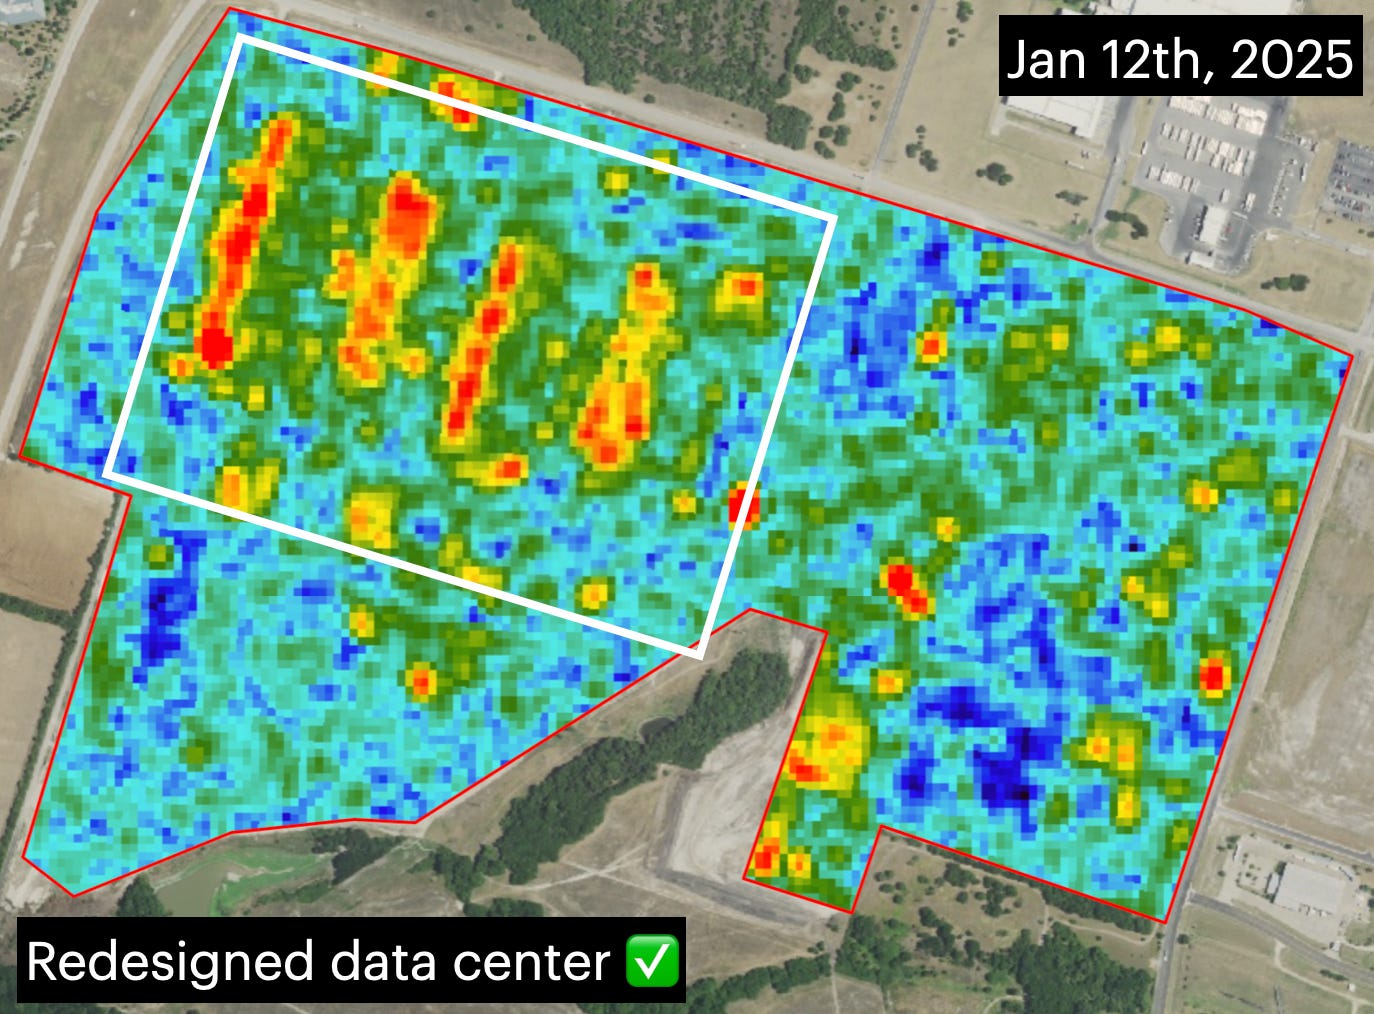
D. Redesigned data center
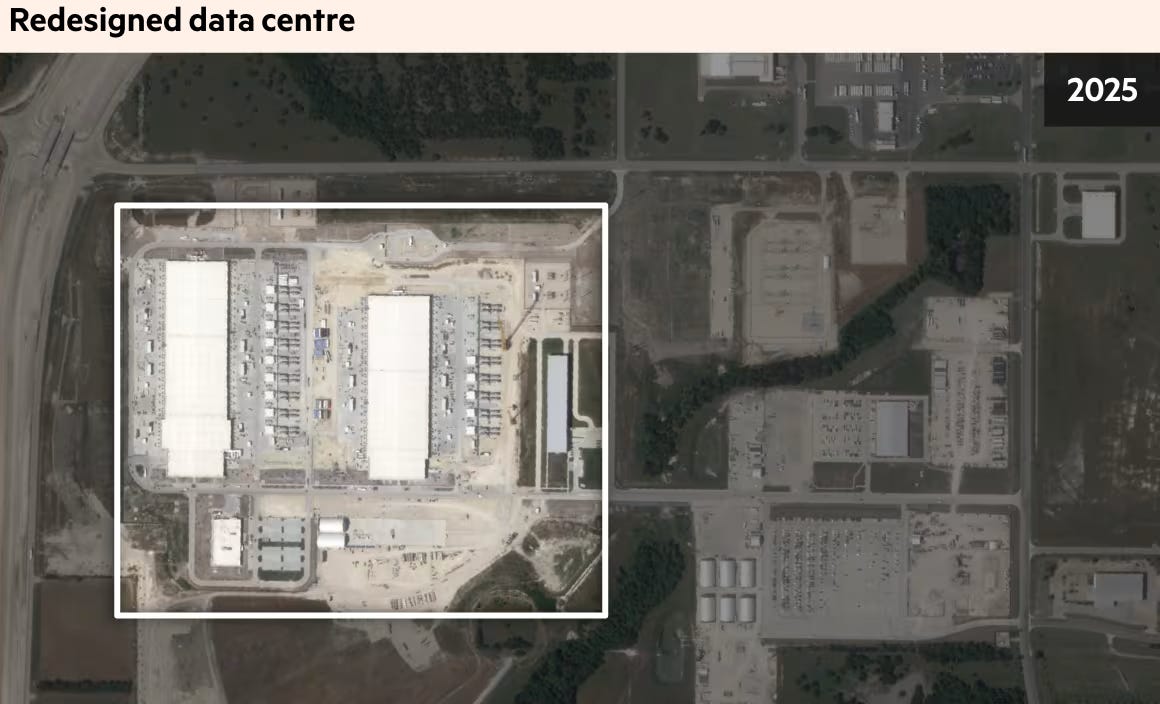
Step by step, we were able to closely match the FT’s reported timeline of events. Beyond that, our data allowed us to assign precise dates — practically down to the very day — for each of the four construction stages (A through D).
The next step is to determine whether we can extract some analytics by integrating data from all three of our sensors.
2. Satellite Analytics on Meta’s Texas Facility
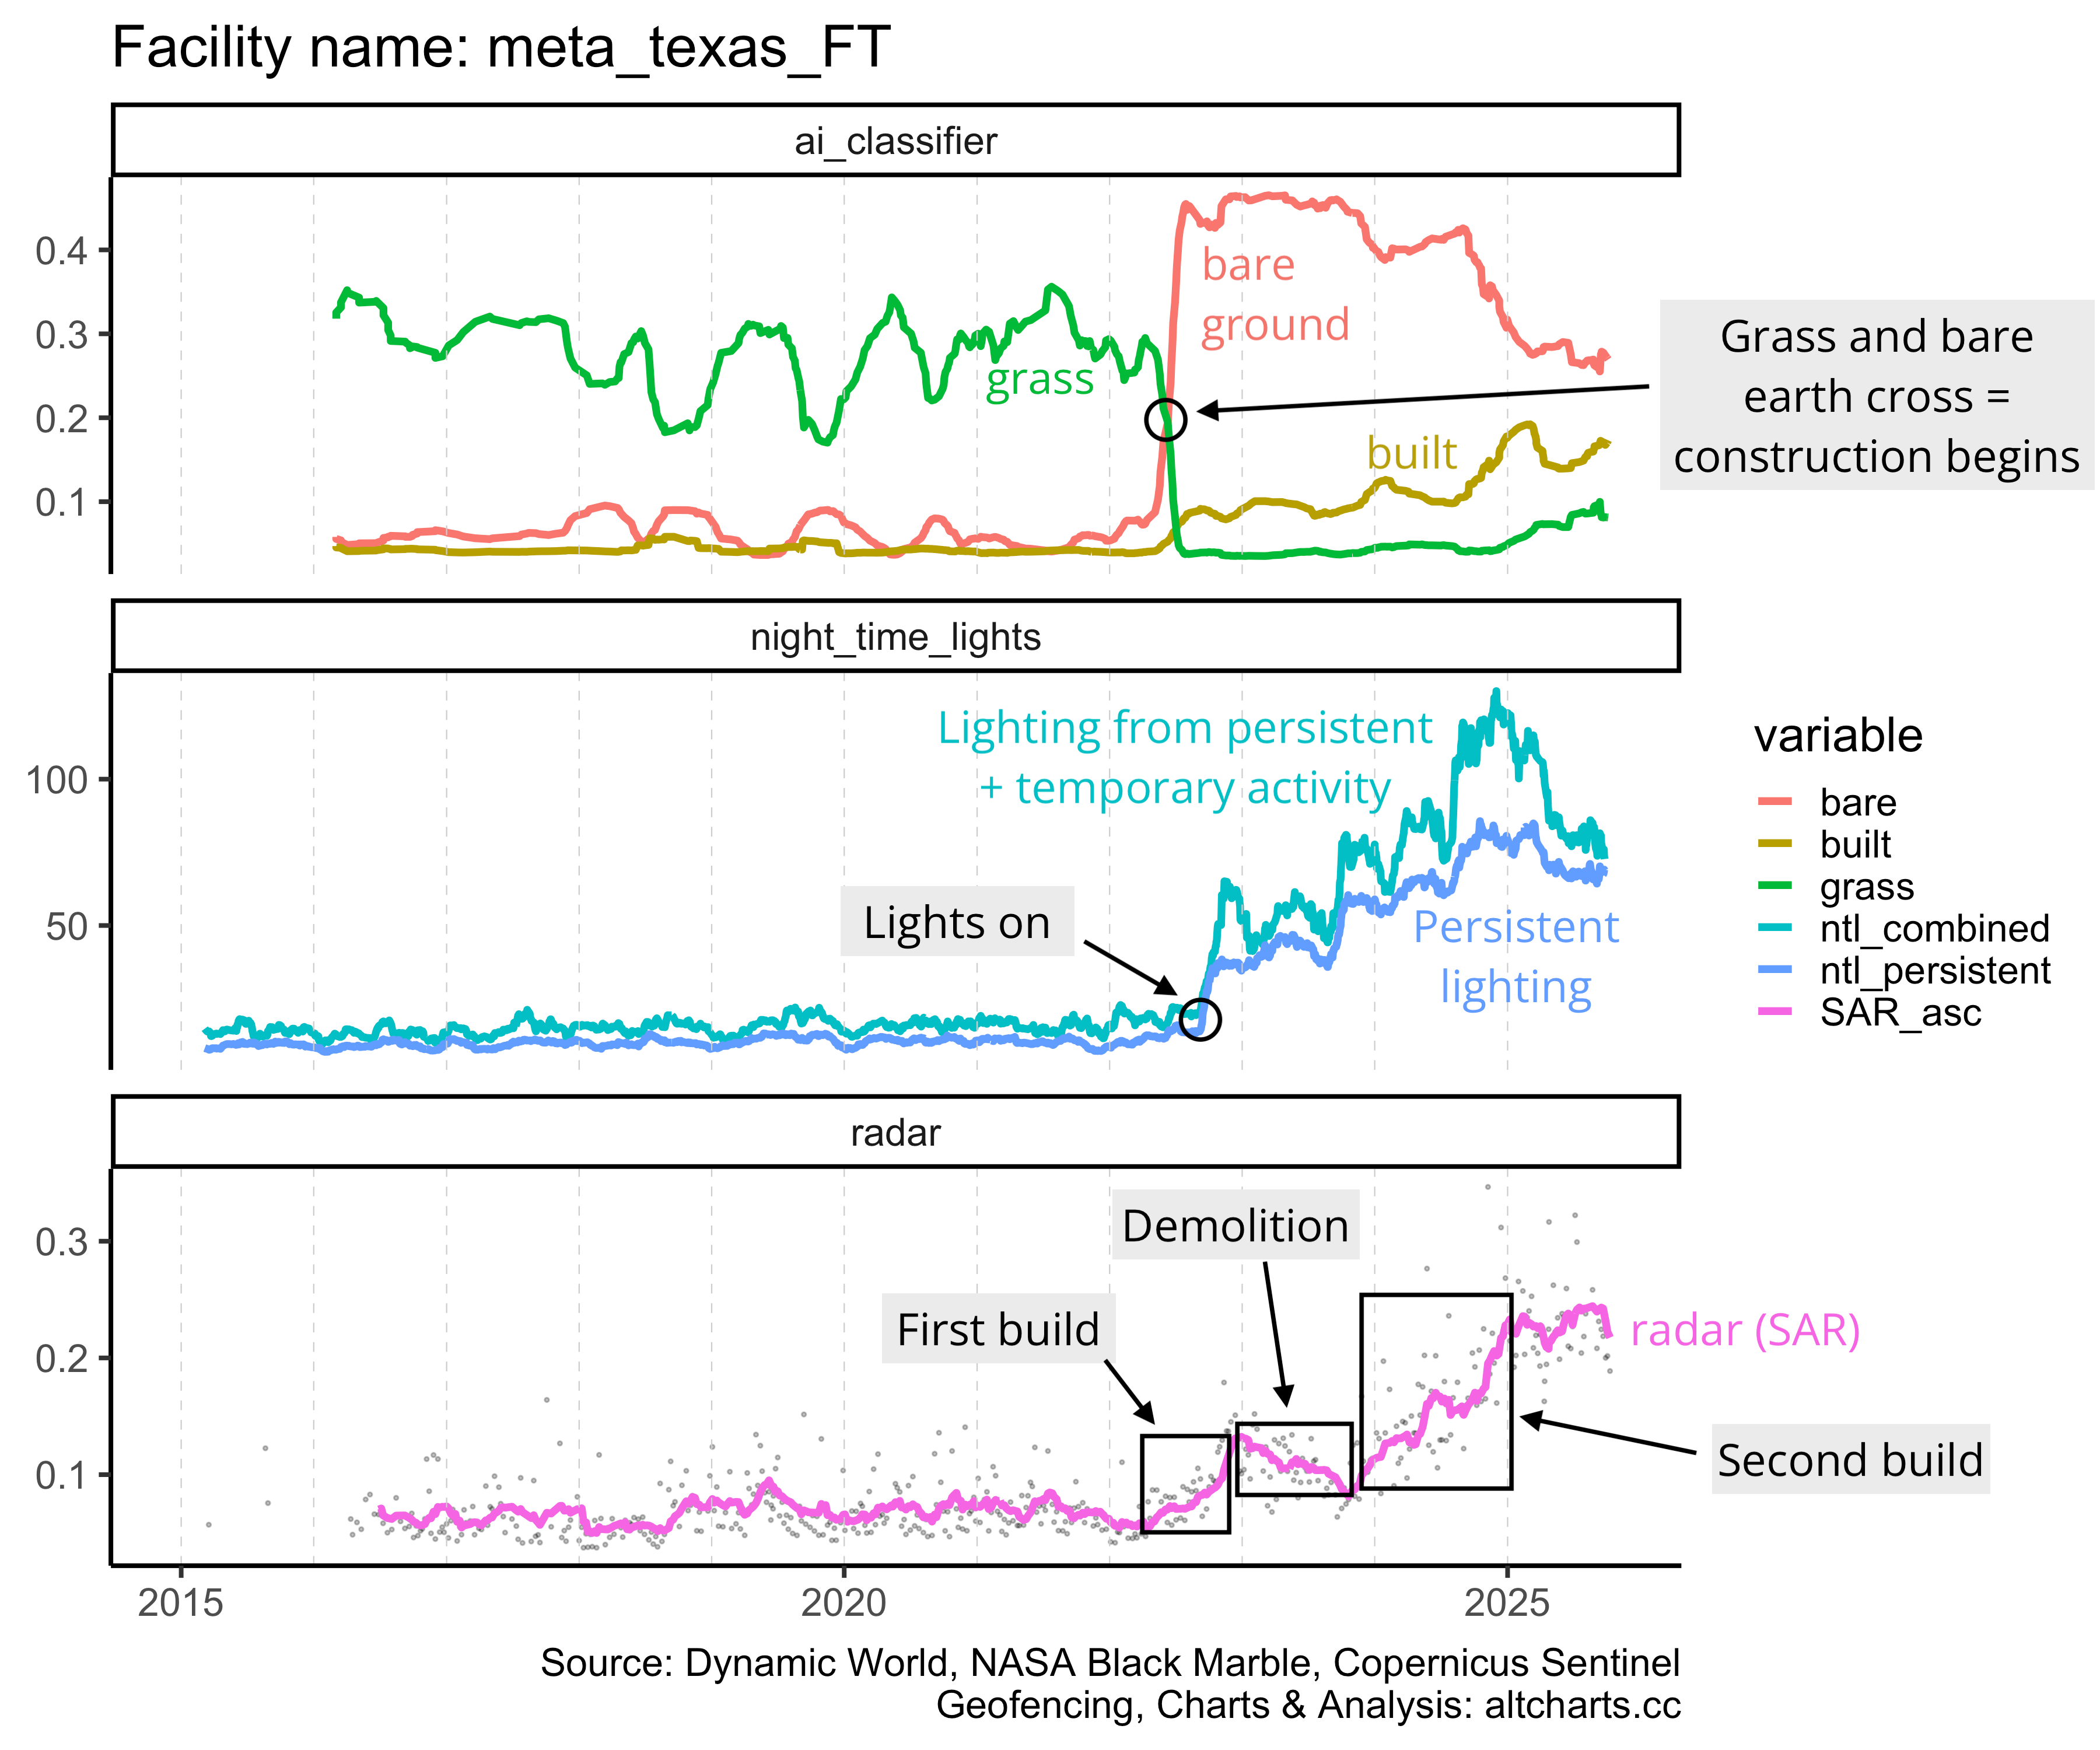
Now here’s the really cool part. Not only can we take snapshot sensor images of the facility, but we can also extract quantifiable data from these and plot them over time. After all the fancy data footwork, we arrive at this chart above.
From the three sensors, we can extract the timeline of events:
Construction begins on June 12th, 2022, as indicated by the AI Terrain Classifier: areas of grass (green) and bare ground (red) form a distinct cross pattern, marking the start of site preparation.
The lights were first switched on on September 14th, 2022, signaling the start of the initial build. This is confirmed by the Night-Time Lights (NTL) signature.
Between January and November 2023, radar (SAR) readings declined, suggesting site rearrangement or partial deconstruction (more reporting here). By February 2024, the radar signature (SAR) rebounds and surpasses previous levels, indicating renewed activity and expansion.
Overall, the satellite signatures from all three sensors provided a clear, near-real-time summary of on-the-ground activity.
3. Backgrounder on Satellite Sensors
To round off today’s post, we provide some background information about each of the sensors and their capabilities.
AI Terrain Classifier
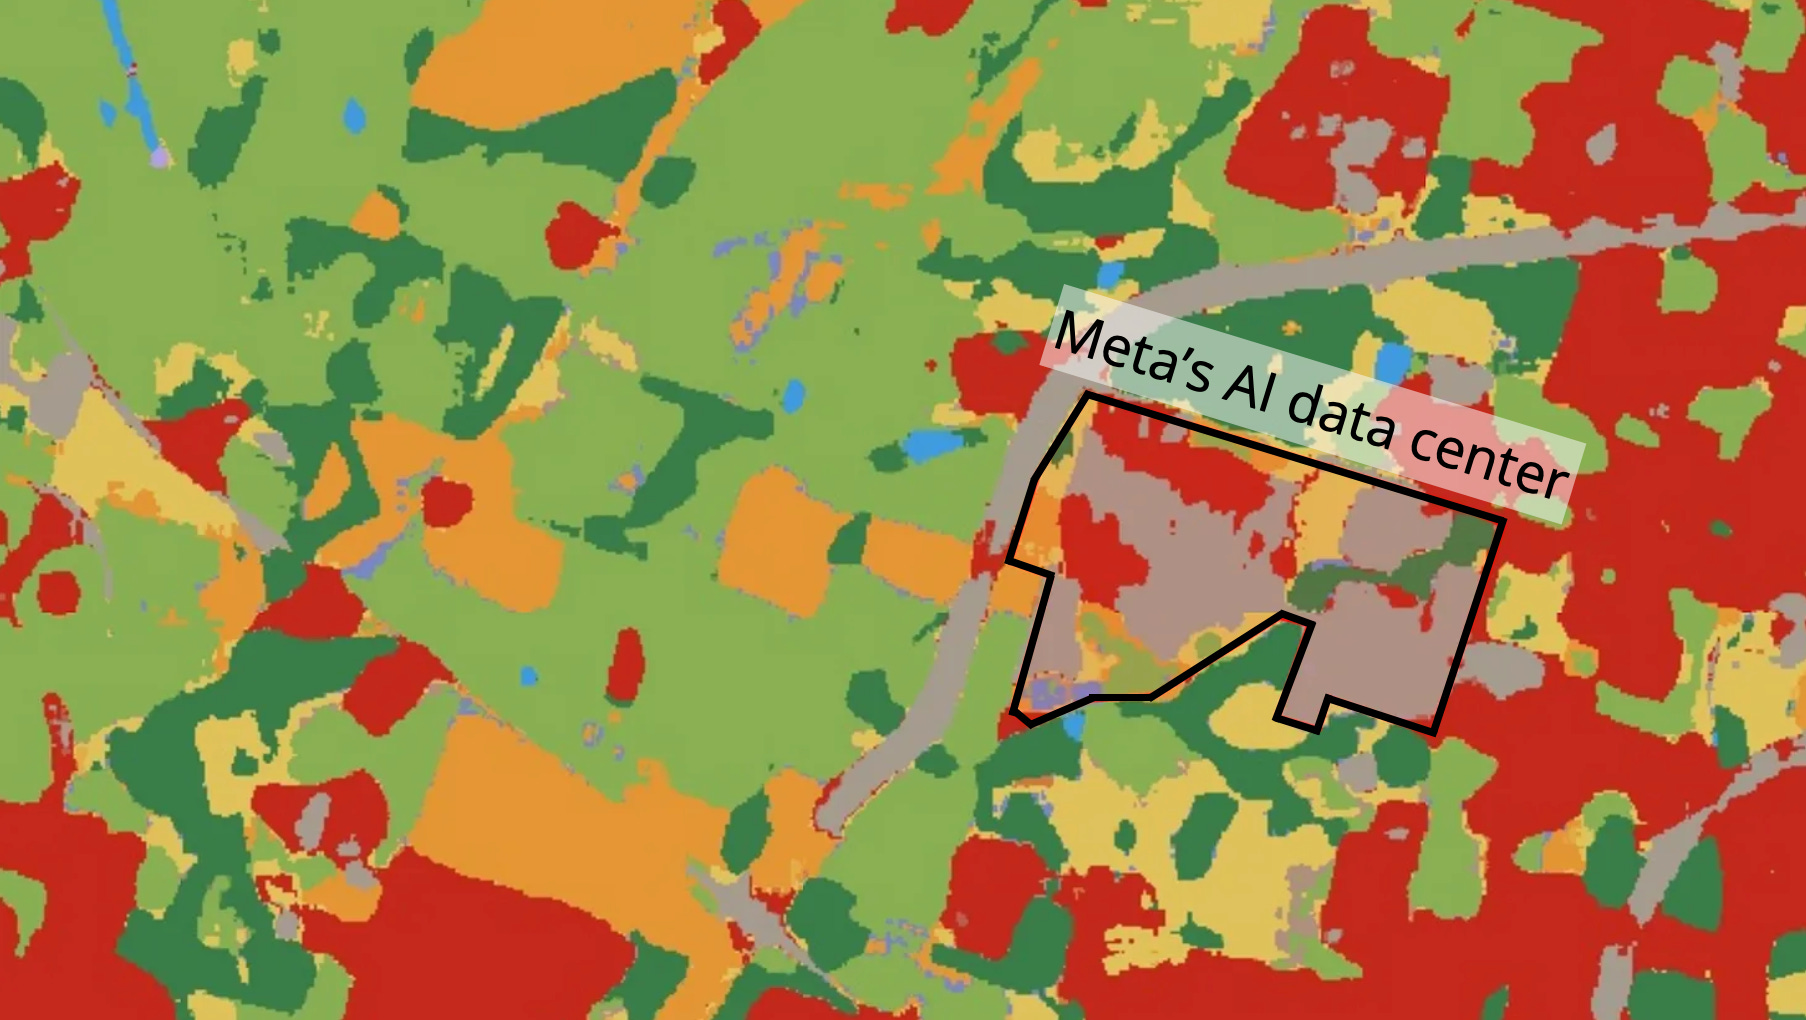
The AI Terrain Classifier is based on the Dynamic World model, a machine-learning algorithm trained on Sentinel-2 multispectral imagery (from ESA’s Copernicus Programme). It automatically categorizes land cover types (such as vegetation, built-up areas, or bare ground) at high temporal resolution. Changes in these classifications can indicate construction activity, operational expansion, or environmental impact surrounding key assets.
The classifier is updated daily.
Sensor source: Dynamic World
Night-Time Lights (NTL)
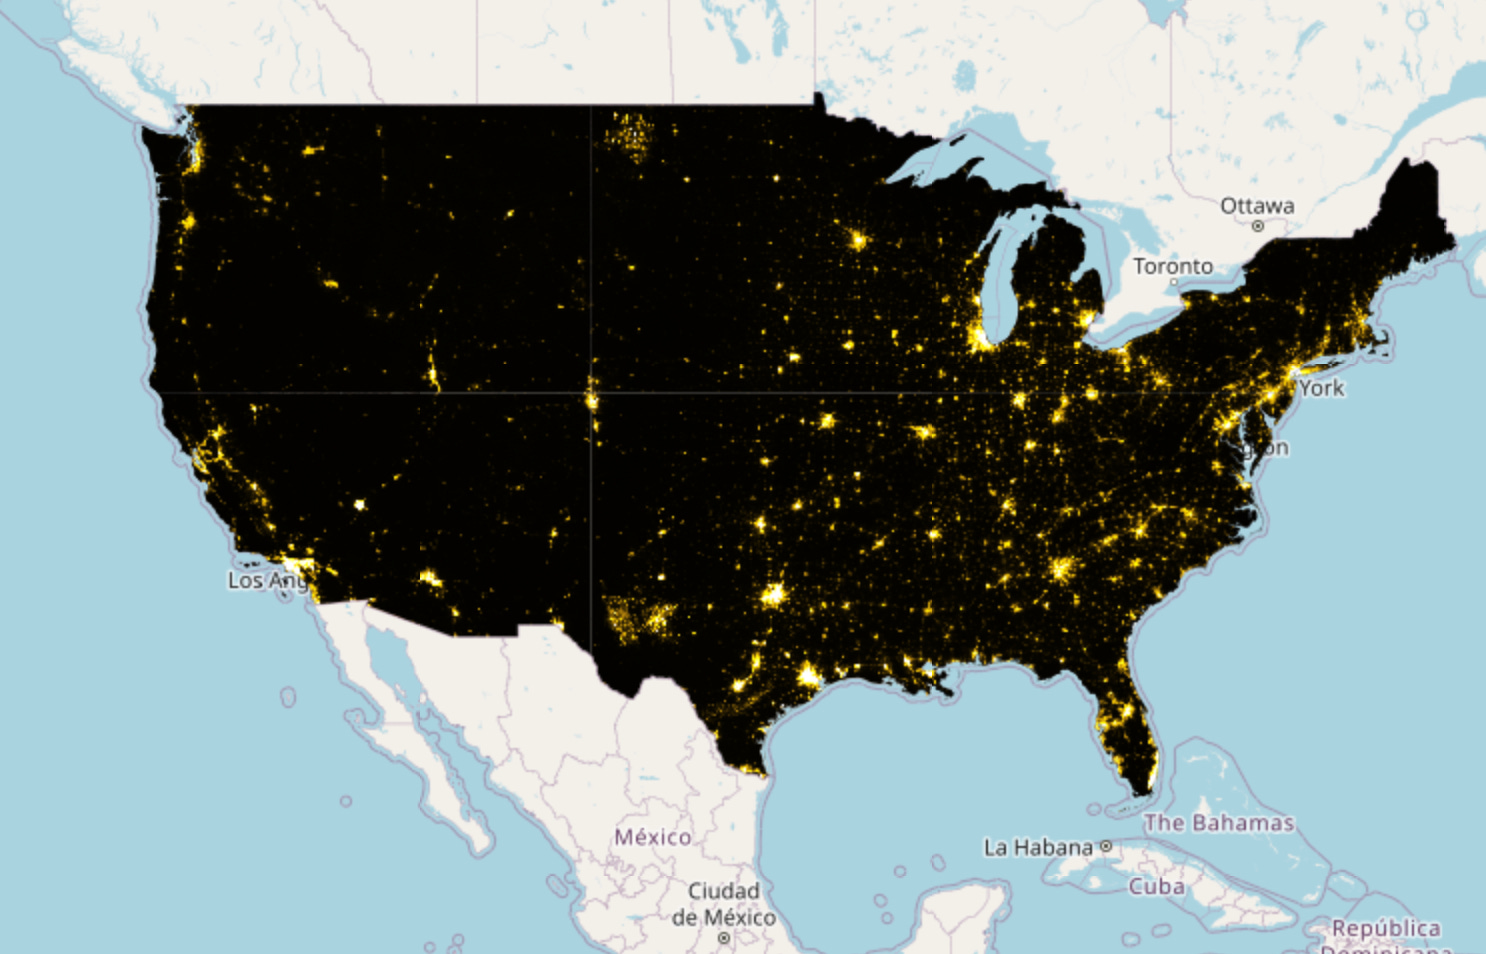
Night-Time Lights (NTL) data measure the intensity of artificial illumination visible from space, providing a reliable proxy for human activity, industrial operations, and economic output. Consistent changes in NTL intensity can reveal shifts in energy use, infrastructure growth, or temporary shutdowns — allowing investors to track real-world activity across facilities and regions in near real time.
Satellite coverage is global with daily revisit times.
Sensor source: NASA Black Marble
Synthetic Aperture Radar (SAR)
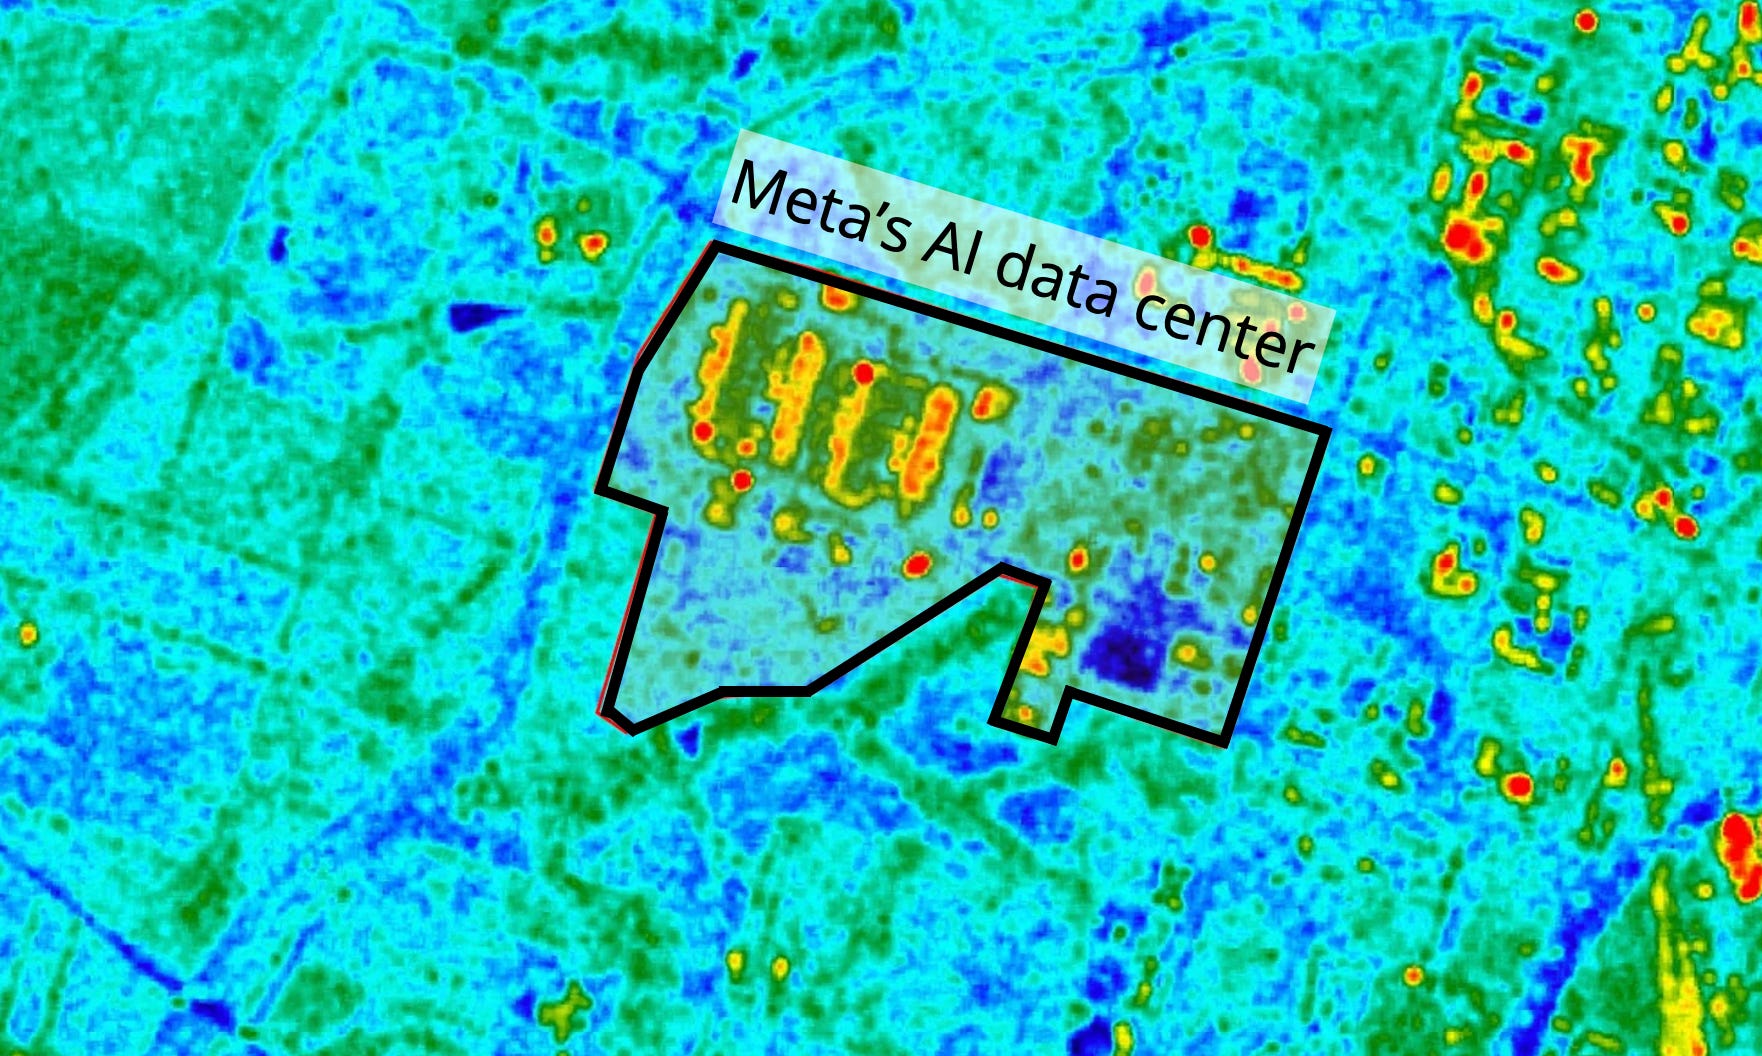
Synthetic Aperture Radar (SAR) uses microwave pulses to image the Earth’s surface, unaffected by cloud cover or daylight. It is particularly useful for detecting structural changes, land deformation, or variations in surface moisture. For asset monitoring, SAR enables consistent observation of industrial facilities, storage tanks, and infrastructure even under poor weather or low-light conditions.
Global coverage with a 6- to 12-day revisit interval, depending on the region.
Sensor source: Copernicus Sentinel-1 (ESA)
Thanks for reading! If you enjoyed this post, please consider subscribing or sharing it with your professional circle.
Have ideas for what we should cover next? Reply to this email — we’d love to hear from you.
I’m a data analyst with an interest in the economy. I like satellites and charts.